Infographics
Click Here to see the full size infograph at the right of the screen.
Charts and graphs communicate data; Infographics use pictorials to turn data into information which is shared by Social Media including Press Releases which in turn, generally credit the originating website
Tell your story, drive traffic to your site, and increase your presence on social media all with data visualization, other known as Infographics. Add this eye-catching tool to your arsenal to quickly convey your message in a customized, easy to comprehend format.
- Infographics can be imbedded in your website, incorporating your branding colors, logos, messages, etc. They can be created in all shapes and sizes to complement your existing design.
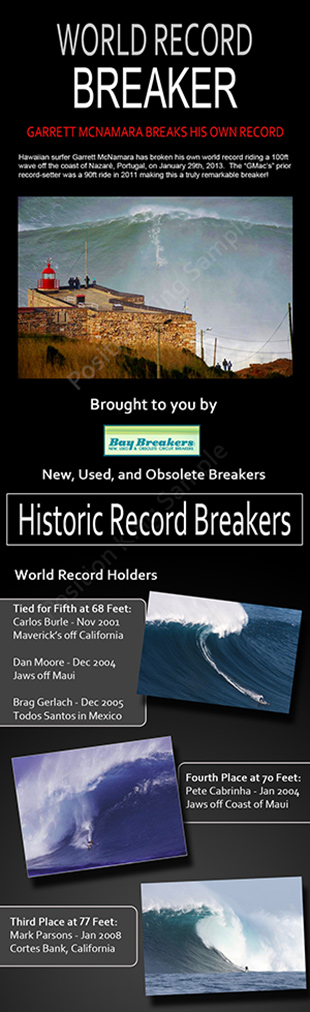
- A popular format is the skyscraper, with an example created by PositionKing shown on the right of this page which works well with scrolling applications such as mobile devices. As shown, data visualization starts with via eye-catching pictorial message conveying your point across in an interesting and fun way.
- Infographics can be static or dynamic, the latter constantly changing to reflect new and fresh content. In this particular infographic, a popular current event, the record-breaker 100-foot surfing feat by Garrett McNamara is pictured along with visuals of previous record breakers, all tied in to the branding of the business that specializes in circuit breakers.
- Information graphics or infographics are graphic visual representations of information, data or knowledge intended to present complex information quickly and clearly. They can improve cognition by utilizing graphics to enhance the human visual systems ability to see patterns and trends. The process of creating infographics can be referred to as data visualization, information design, or information architecture.
- Infographics provide a dynamic and visual means of communicating an idea or product and when picked up by the online community, provide strong back link support.
Several on-line infographics creators, such as Infogr.am, Piktochart and Easel.ly has been launched in 2012. Those are sites that allows users to create infographics from pre-designed templates, add custom data and share infographics and charts on the web or download as pictures for placing in presentations. Infogr.am is a free service that generates interactive, javascript based online infographics and charts.[27] Piktochart is a site that allows users to create infographics using pre-defined themes that allow some customization. Users can export an image of their infographic when they are done. Free access is limited, but a paid subscription allows users to create more infographics and utilize many more themes. Easel.ly is another free infographic creation site utilizing themes. Users have a canvas that they can drag themes and customizable graphics onto in order to personalize the look of their infographic.
The PositionKing graphics team will create a custom, distinguishable infographic for you, incorporating your message and brand. It will be submitted to specified sites for instant viewing and sharing across the web universe!
Follow @seochief